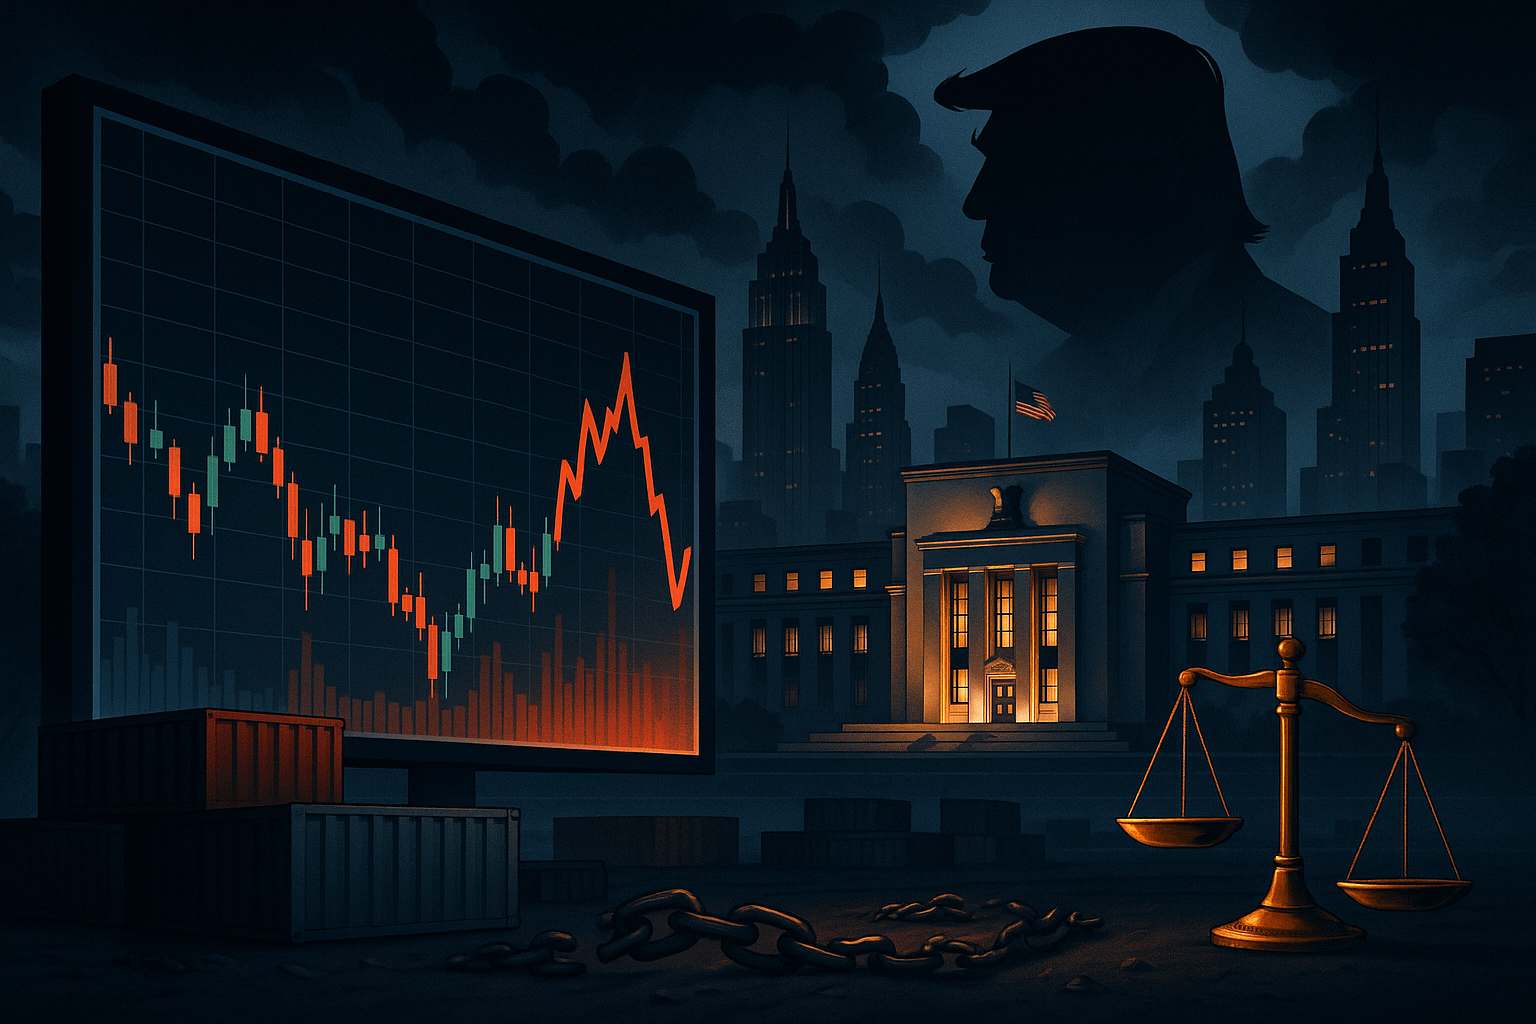
In 2025, data clearly shows a balance sheet reduction of the Federal Reserve. At the end of April 2025, total consolidated assets minus Fed eliminations were about $6.709 trillion. Comparing this to the peak at the end of 2021, JPMorgan calculates an overall contraction of about $1.7 trillion. The main factor contributing to this reduction is the repayment of maturing securities and the non-full replacement of open market sales; the reduction program is still limited by statute to $25 bn/month of Treasuries and $35 bn/month of MBS, as reminded by the Fed itself.
It must also be stated that the reverse repo facility has become the dominant channel of liquidity drainage. By serving this type of transaction, the Fed sells securities to the market under reverse repo for one day. Since early 2024, there has been a historic surge in daily deployments: as of April 2025, the average daily volume often exceeded $100 billion, with peaks as high as $171.8 bn. This phenomenon reflects financial institutions’ demand for safe parking, given the now high remuneration of RRPs, which reached 4.6% on overnight in May 2025. JPMorgan claims that this facility has so far absorbed almost all of the balance sheet contraction. However, with less than $300 bn of space remaining in the RRP, the QT needs additional venting channels; in the future, if the net balance sheet continues to decline at the current pace, a reduction in bank reserves will be inevitable, unless the Reverse Repo Program is further expanded.
Tensions in fixed income and equity markets
QT and rising rates are reflected in the tense bond and equity markets. The Fed’s latest Financial Stability Report, in April 2025, notes that liquidity in Treasury and equity markets was low and deteriorated further in the same month though without major trading disruptions. The environment remains, therefore, dry: market makers struggle to provide ample placements, and the depth of order books is extremely limited. Illustrative figure notes in the report point out that Treasury market depth fell further in April 2025 from already very low levels, approaching historic lows, as shown in the chart below.

Even in ES futures, an important liquidity indicator, values are observed well below the historical average. In other words, both government bonds and stocks trade with wider-than-normal bid-ask spreads and relatively thin volumes.
On the price side, Treasury yields remain historically high: rates of all maturities are above average levels since 2008. Since the last rise in 2023, 2-year and 10-year yields have set new multi-year highs. Rate fluctuations have also been pronounced: for example, prior to August 5, 2024, U.S. market open, the VIX alone had flown to crisis levels, even in the absence of a commensurate drop in the underlying index.


The Fed also notes that during the period from November 2024 to April 2025, equity markets experienced sharp declines: after a rally in late 2024, between late February and early March 2025, indexes lost more than 6%. Despite this correction, P/E multiples are still high relative to fundamentals.
Corporate credit segments showed similar but more moderate strains: spreads on corporate bonds widened significantly but remained within historical averages. In contrast, issuance of new corporate paper has contracted under conditions of high volatility, reflecting conservative investor demand.
For longer-risk assets, reports show mixed signals: house prices continue to rise, while commercial real estate shows signs of stabilizing, but with the risk of turbulence due to large debt maturities in the coming years.
On the financial institutions side, bank deposits and balance sheet stability suggest good resilience: the Fed indicates that most banks maintain among the highest level of liquid assets ever. Money market funds have completed regulatory reforms and flows into instruments with structural liquidity risk, such as prime MMFs, have reduced; significant leverage remains in the hedge fund sector: by spring 2025 hedge managers remained at their highest in more than a decade according to Fed estimates, although much of that leverage was eased by the funds themselves in the first weeks of April.
A further sign of tension emerges from the swaps and repo markets: according to Fed reports, external analysis indicates that in the overnight repo markets, funding rates briefly outperformed the official rate, an indication of momentary reserve rarefaction. In any case, overall conditions remain manageable for now. Also, according to JPMorgan, “QT has not yet significantly impacted the money market space: there still appears to be some margin before reaching thin reserve conditions.” As remaining RRP assets are depleted, there is risk of a sudden tightening of reserves: over $300 billions of RRP could be drained; if reserves fall too fast, overnight rates could spike as they did in October 2019.
Changes in bid-ask and execution costs
One of the most visible effects of liquidity strains is the widening of trading spreads. The Fed reports illiquid conditions, but for more granular details we need to look at specific studies: an analysis by the Bank for International Settlements (BIS) of the exceptional volatility spike on August 5, 2024, shows how market makers react under stressful conditions. On that day, the VIX exploded from about 24 to 66, a +180 percent pre-opening, with a relatively modest decline in the S&P 500. According to BIS, this VIX boom was not driven by ETF flows or a true uptick in volatility in trades, but by the asymmetric widening of options bid/ask spreads. Dealers, finding themselves with unbalanced portfolios and low liquidity, greatly widened bid/ask spreads, especially on less liquid puts: the mid-quote of options, was inflated by the disparity between bid and ask.
This phenomenon is illustrative of how, in phases of sudden volatility, execution costs explode; widening spreads are compounded by limited book depth, so that even relatively small trades can move the price a great deal. When market makers are short range, i.e., net sellers of options, they become bullish on a decline in the underlying by selling futures to hedge and bearish on a rise by buying futures.
US options markets in 2025: short gamma and squeeze risks
In 2025, U.S. options markets reflect these dynamics of volatility and vulnerability: on major stock indexes, such as the S&P 500 and Nasdaq, a strong short gamma condition remains. Many investors maintain selling positions in at-the-money options at short maturity. Market makers result short gamma: if the index goes down, they sell futures to adjust hedges, if it goes up, they buy them, redeeming the effect amplified feedback in price movements. The Fed cites industry studies that show that on strike-concentrated open interest, peak open interest typically remains around current index levels, raising the risk of gamma pinch: if price remains pegged around a strike with a lot of option expiration, dealers continually adjust their positions without much deviation in the underlying, until a sudden acceleration breaks that equilibrium. In practice, the presence of much liquidity concentrated on a few strikes can incentivize technical swings and constrain price: a phenomenon known as gamma-pin. We note that, in the past, month-end expiration moments have seen such positioning plays on the S&P 500.
Tesla and Nvidia under pressure
Even more pronounced are exposures to large-cap single stocks in the technology sector. Tesla and Nvidia dominate the options landscape in 2025, both in terms of volume and concentration of positions. According to data reported by S3 Partners, shorts on Tesla stocks accumulated profits of $11.5 billion in 2025, followed by $9.4 billion in profits on Nvidia shorts. This indicates not only a strong bearish stance on the equities themselves, but also a high volume of put options and short selling on these stocks: this situation increases the risk of a technical short squeeze; if for some reason, such as good corporate results or positive news, Tesla or Nvidia were to experience a strong rise, investors who have sold calls or maintained short stocks would be forced to buy shares to cover the positions: this mechanism, amplified by option selling, can generate very rapid price spirals. It is no accident that, in late 2024, any bullish movement in high-beta tech stocks led to nervous trades; hedging flows and option volumes at key levels triggered repeated increases in implied volatility.
A spectacular short squeeze such as those seen years ago on meme stocks has yet to occur, but analysts point to the current fragility: with such a high concentration of short positions and expiring contracts on Tesla/Nvidia, even a moderate uptrend could trigger forced selling and strong accelerating bullish pressure.
Finally, options on other heavily traded names such as Meta, Microsoft, or emerging AI stocks show similar range dynamics: open interest tends to encumber around key strikes close to the current price, leaving market makers exposed to large hedging adjustments should the underlying move. This fuels ongoing fears of gamma-pins and sudden breakouts, especially in the face of macro announcements or Big Tech decisions.
Outlook for the second half of 2025
The scenario for the remainder of 2025 will depend greatly on the evolution of monetary policy and the reaction of markets. If inflation confirms a descent toward the target as the updated Fed expectations also indicate, a slowdown in the pace of QT or even a pause by year-end could be on the horizon: such a turn would stagnate the balance sheet around current levels, slowing liquidity drain and easing strains on Treasuries, and in that case we could see bond yields more stable or falling slightly, with a moderate decline in market stress measures. Conversely, if the Fed continues to reduce the balance sheet at the pre-established pace until the end of 2025 (25+35 bn/month), net reserves would continue their fall: once the remaining RRP, the so-called term auction amount of $300 bn, is exhausted, it would be the turn of reserves and we could see spikes in overnight rates as in fall 2019.
On the equity side, a moderate easing or a slowdown of QT, would tend to favor prices: less restrictive policies increase risk appetite, reduce required returns on stocks, and often result in lower levels of volatility. This would help calm some of the credit spreads and bring back spikes in implied volatility. However, with high multiples and uncertain macro variables, the correlation between equities and bonds would remain high, leaving room for profit-taking and technical selling phases. Geopolitical events or unforeseen shocks such as supply blockages, emerging financial crises, remain possible volatility triggers.
In the options segment, a tightening of monetary conditions could keep implied volatility levels high and press those who are short gamma. Conversely, if volatility returns to historical averages, some speculative placements would be scaled back: in a calmer market, dealers can gradually reduce short gamma hedges. However, any macro surprise or company report exceeding expectations can quickly reactivate old risks, such as, for example, a new wave of buying on AI-tech stocks, which could trigger squeezes as in past months by running prices against shorts once again. Similarly, should the S&P 500 market languish on one of its key ATM strikes, dealers could exert gamma-pin pressure until a turn breaks the equilibrium.
Realistic projections for the second half of the year indicate a moderate rise in systemic risk under certain scenarios, but also possible periods of calm if macroeconomic conditions come back under control. In any case, investors’ attention will remain focused on changes in tensions in financial markets and derivatives dynamics, looking for the first signs of regime change. With liquidity tightening, markets exposed to gamma squeeze risks, and a Fed that may soon be at a crossroads between QT and financial stability, traders will need to balance hedging, duration management, and tactical option placements. The second half of the year promises to be eventful; volatility management will be crucial.
Conclusions
The Fed’s tightening is, therefore, compressing systemic liquidity just as markets increasingly rely on highly leveraged, shallow instruments. In this context, the combination of QT, compressed implied volatility, and extreme positioning creates rich ground for disruptive events. If the market breaks the equilibrium, it will do so suddenly, without any safety net.