In this article we a going to present a trading strategy based on this relationship.
Most of the time, implied volatility is greater than realized volatility, meaning that the expectations are more pessimistic than what reality is. In this case, the Vix index will trade above the realized volatility and we can call the difference between those two measures ‘implied volatility premium’. In the other case, when realized volatility spikes up and stays above Vix index, options market is not able to price correctly the risk in the market and we can define this situation as ‘implied volatility discount’, since implied volatility results cheaper than realized.
Based on those observations, our trading strategy will exploit these two situations and try to extract the information in order to produce a trading strategy that is able to outperform a buy-and-hold strategy on the equity index.
This strategy is based on two assumptions that can be empirically proved:
1. Bull market trends usually happen in a low volatility environment and bear market trends are characterized by big swings and big spikes in realized volatility.
2. When implied volatility trades at a premium, there is no real fear on the market and prices tend to go up. In the other case, when realized volatility is higher than its implied counterpart, the risk might be higher than what market is pricing and the index usually goes down.
Now, imagine a situation where the VIX index is below the historical realized volatility of S&P500. In this case, the market is pricing a risk bigger than the realized risk and consequently implied volatility will be repriced (at lower values) and the market will go up. In the opposite situation, when market is having big swings, with realized volatility greater than implied volatility, the expectations will probably follow the realized vol and the VIX will trade at higher prices.
Usuallly, building something that beats the market is very hard so our strategy is a long-only strategy with daily rebalancing that goes long SPY (S&P500 ETF) when implied volatility is greater than realized volatility and goes cash when realized volatility becomes higher than implied volatility. Both time series are smoothed using exponentially weighted moving averages, to avoid overtrading and clear out some noise.
The results are pretty impressive. The strategy is not only able to beat the buy-and-hold benchmark (excluding transaction costs), but also the maximum drawdown is much more under control, which is probably the most interesting feature of this example.
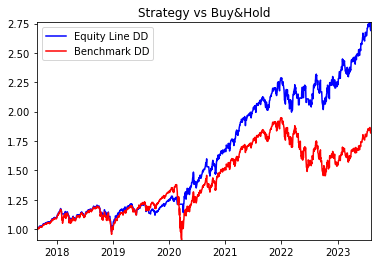
We chose the beginning of 2018 as the start of the time series to fit the strategy, because in February 2018 there has been an outstanding event (due to an overcrowded position in the front month VIX futures) that never happened before, and changed the role of VIX as an index and its traded futures forever.
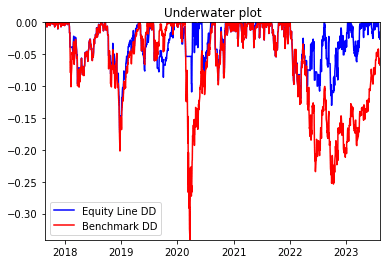
The Underwater plot clearly shows that we could avoid heavy losses, derived from wrong market timing using this criteria to stay long or cash. The historical time series includes two periods of market stress, around March 2020 (COVID pandemic) and the 2022 stagflationary environment along with aggressive rate hikes. While the S&P500 was having a drawdown greater than 20% in these two periods, the strategy would have protected investors limiting the drawdown only at 10% showing a pretty strong risk control.