By Marco Santanche, Founder, Unbiased Alpha · 6 Nov 2026
On Wednesday, the day after the midterms, Microsoft and Amazon closed more than 6% higher while Vistra and Vertiv fell 13-14%. Same theme, opposite sides of the same trade. By Thursday’s close the semiconductor index had posted its second-worst day since the COVID crash, and the VIX had jumped almost 70%.
There’s no shortage of headlines about the AI stock selloff. What’s harder to find is a sober look at what the price data says. So here’s our attempt, with the charts we built for ourselves first.
The short version:
- The PHLX Semiconductor Index (SOX) fell 12.2% on 5 November. Measured against its own trailing one-year volatility, that is a 4.2-sigma day.
- The SOX is now 38% below its 22 June peak. That is its second bear market in 19 months.
- The AI stock selloff hit the suppliers of the AI build-out (chips, data-centre hardware, power, neoclouds). The hyperscalers writing the cheques barely moved.
- Correlations across chip stocks are at 0.81, compared with a median of 0.52 since 2025. Volatility like this usually comes from positioning being unwound, not from new information about individual companies.
1. Context first: this came after a huge run
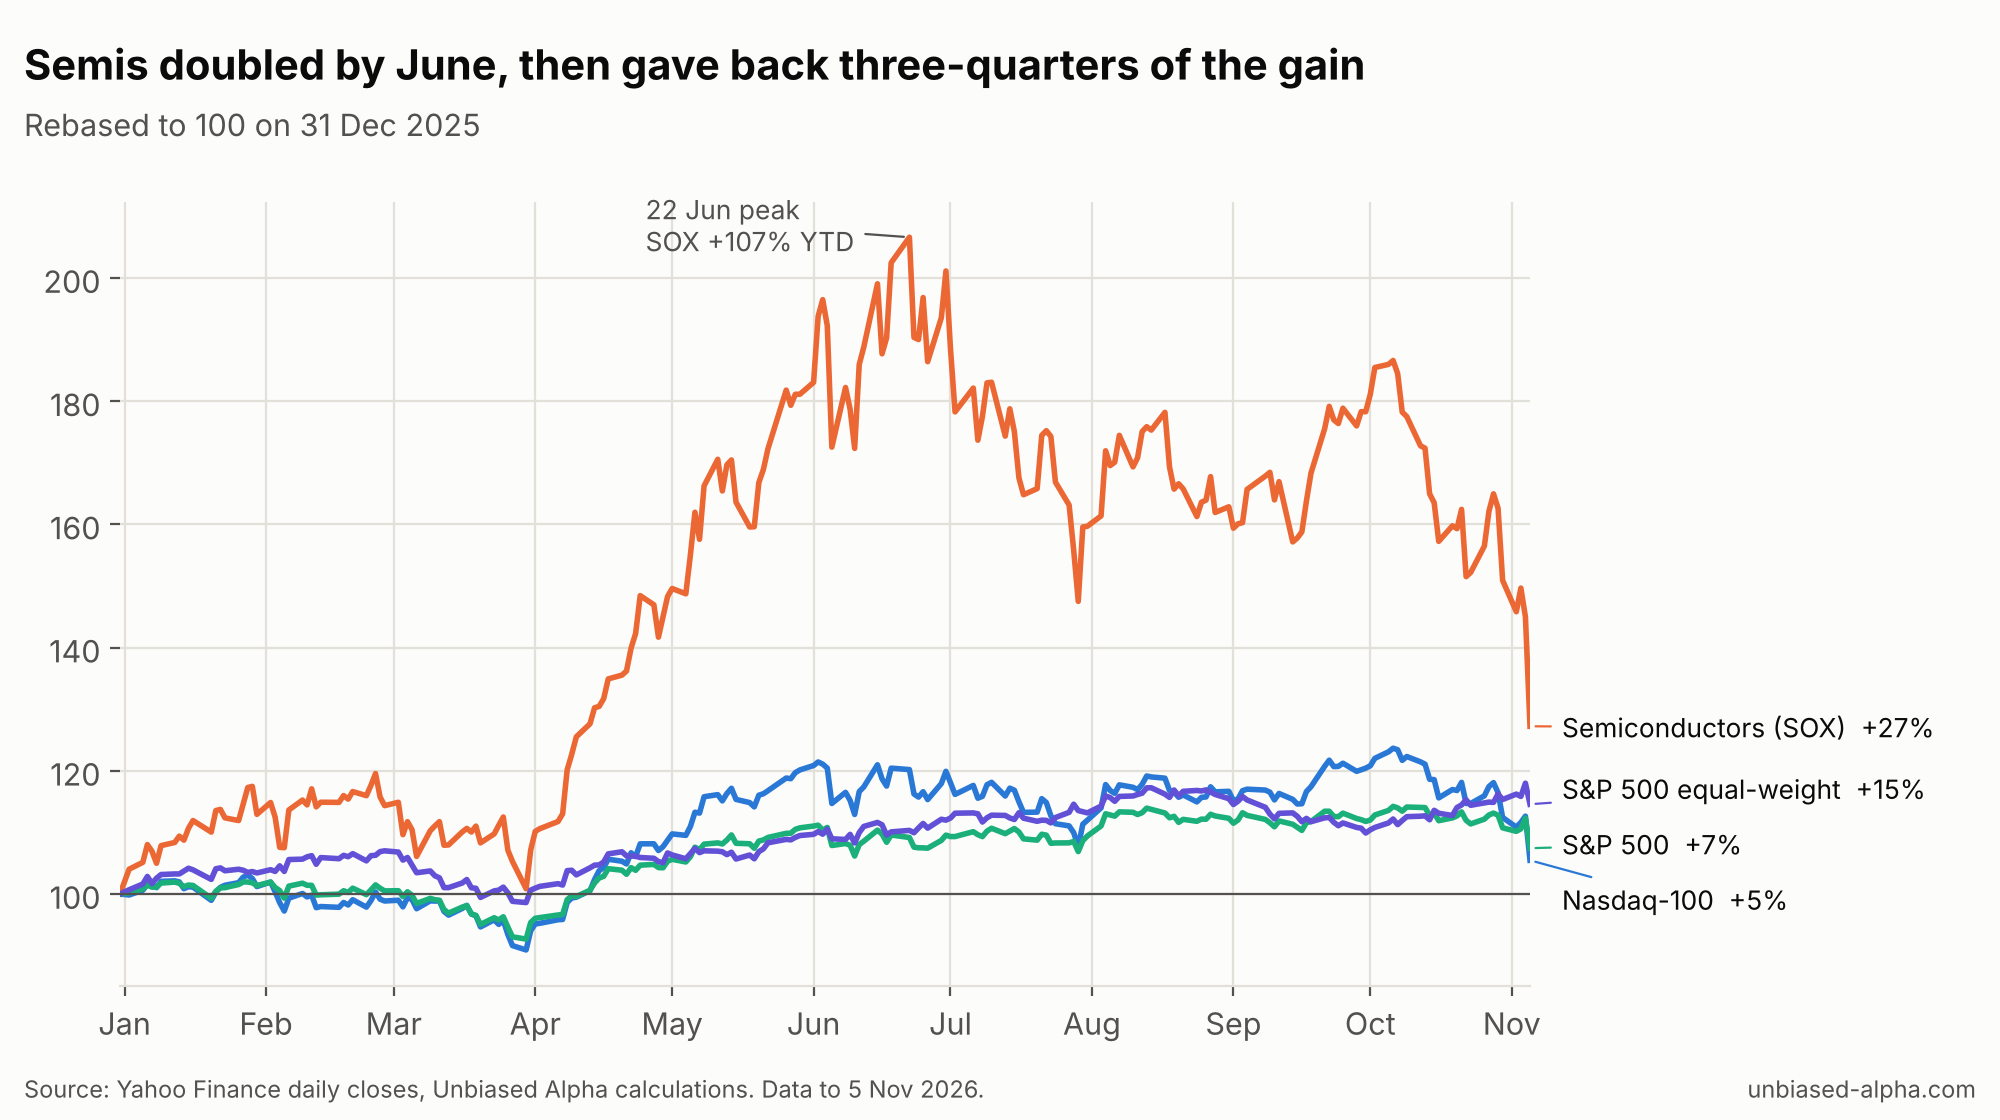
Looking only at last Thursday misses the bigger picture. By 22 June the SOX was up 107% year-to-date. It has given back about three-quarters of that gain and now stands at +27% YTD. That’s still well ahead of the S&P 500 (+7%) and the Nasdaq-100 (+5%).
The pattern on the chart is a textbook lower high. The SOX fell 29% from June to late July, rallied into 6 October, failed below the old peak, and has been falling since. Intel’s 28.6% collapse on 30 October, after weak Q4 guidance, was the first big crack. The midterms broke it wide open.
For individual names, the YTD and drawdown figures together tell the story:
| Stock | Peak (since mid-2025) | From peak | YTD |
|---|---|---|---|
| Micron | 25 Jun 2026 | -46% | +130% |
| Dell | 17 Sep 2026 | -46% | +154% |
| AMD | 6 Oct 2026 | -38% | +89% |
| Marvell | 4 Jun 2026 | -58% | +57% |
| Nvidia | 6 Oct 2026 | -24% | -2% |
| Broadcom | 2 Jun 2026 | -39% | -15% |
| CoreWeave | 20 Jun 2025 | -76% | -39% |
In plain terms: many of the names now falling hardest were the year’s biggest winners. That matters for the “why” question below.
2. How big was Thursday, really?
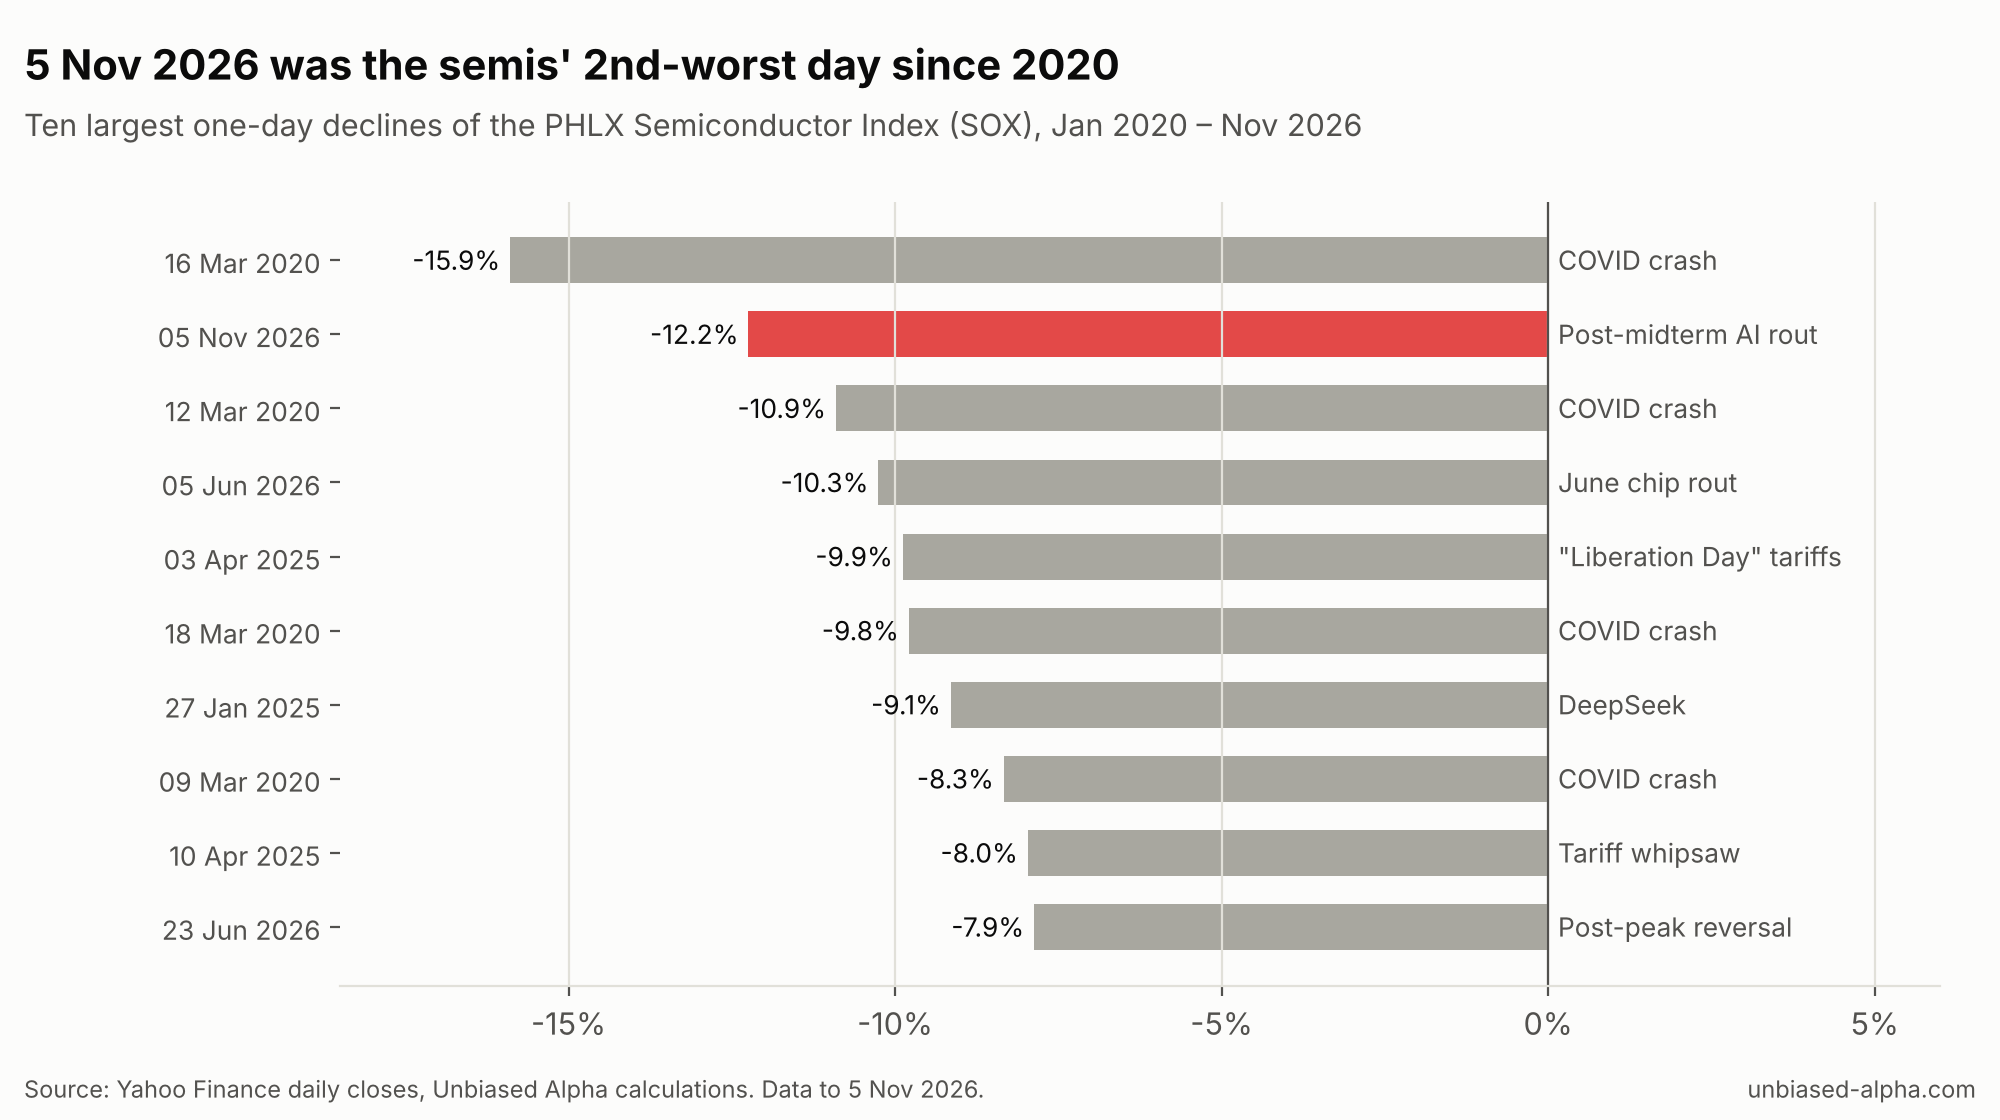
Since January 2020 only one day has been worse for the SOX: 16 March 2020, at the height of the COVID panic. Thursday was worse than the DeepSeek shock (-9.1%), worse than “Liberation Day” (-9.9%), and worse than the June chip rout earlier this year (-10.3%).
The rest of the market:
- Nasdaq-100: -6.4%, its fourth-worst day since 2020
- Nasdaq Composite: -5.5%, closing in correction territory (-11.9% from its 6 October record)
- S&P 500: -4.4%
- VIX: 16.6 → 28.2. In our data, that +70% move is the second-largest one-day percentage jump since 2020. The front of the VIX curve inverted: VIX/VIX3M was 1.10, which signals acute, near-term stress rather than a slow repricing.
Note that three of the ten worst SOX days since 2020 happened in 2026, all within five months. Large moves are clustering. That’s what you see in a crowded trade, not in a sector that is steadily rerating.
3. The market sold the suppliers, not the spenders
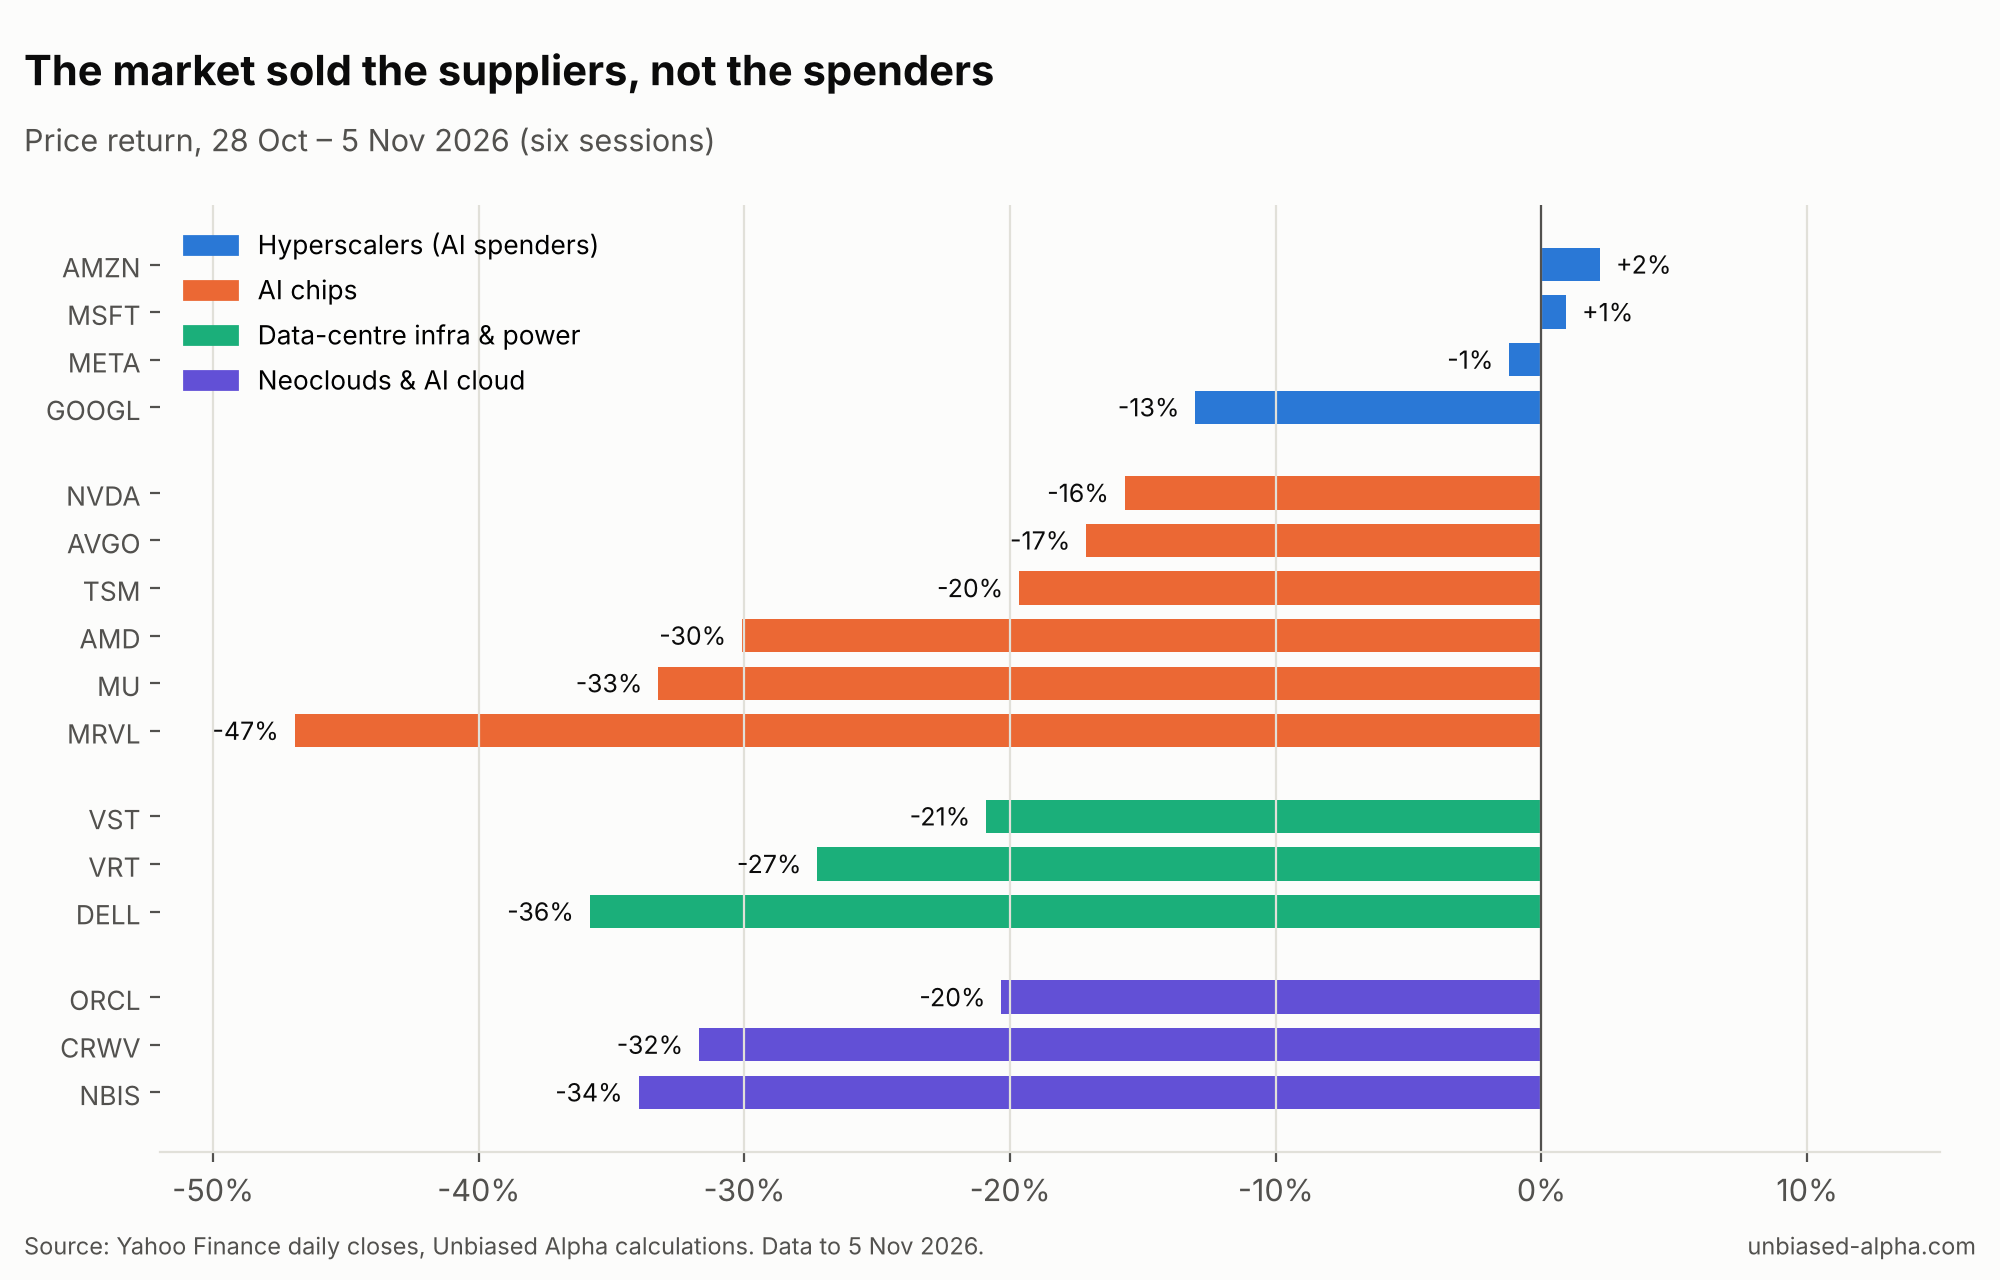
For us this is the most informative chart, and the one the headlines mostly miss.
The AI trade has two sides. On one side are the spenders: hyperscalers committing hundreds of billions to capex. On the other are the receivers: chipmakers, server builders, cooling and power providers, and the neoclouds renting out GPU capacity. In a true “AI is over” panic, both sides should fall together.
That is not what happened.
| Group (equal-weighted) | 4 Nov | 5 Nov | 28 Oct → 5 Nov |
|---|---|---|---|
| Hyperscalers (MSFT, META, GOOGL, AMZN) | +4.4% | -3.0% | -2.8% |
| AI chips (10 large names) | -2.8% | -12.4% | -27.0% |
| Data-centre infra & power (VRT, VST, CEG, DELL) | -10.6% | -9.4% | -22.8% |
| Neoclouds & AI cloud (ORCL, CRWV, NBIS) | -6.2% | -10.6% | -28.7% |
On the day following election day, hyperscalers rallied while power and infrastructure names fell by double digits. The market wasn’t pricing lower AI demand. It was pricing a slower or more constrained build-out of US data-centre capacity. That is bad for whoever sells into the capex cycle. It is neutral or even good for the free cash flow of whoever pays for it.
This fits the narrative from the news flow (see CNBC’s coverage). Investors feared that a Democratic Congress and new governors in key data-centre states would slow permitting and add regulation. UBS strategists estimated that about 30% of planned 2028 data-centre additions could be at risk, according to Reuters. A note from J.P. Morgan’s Michael Cembalest estimated that 37.5 GW of the 96 GW due in 2028 “may be subject to a ‘pause'”. Arm said in its results that power availability is becoming “a critical constraint.”
One important caveat: Alphabet (-13%) is the exception among the spenders. That makes sense because Alphabet is partly a supplier too, through its TPU and cloud business. The split is evident, although not perfect.
4. Why the AI stock selloff was so violent: positioning
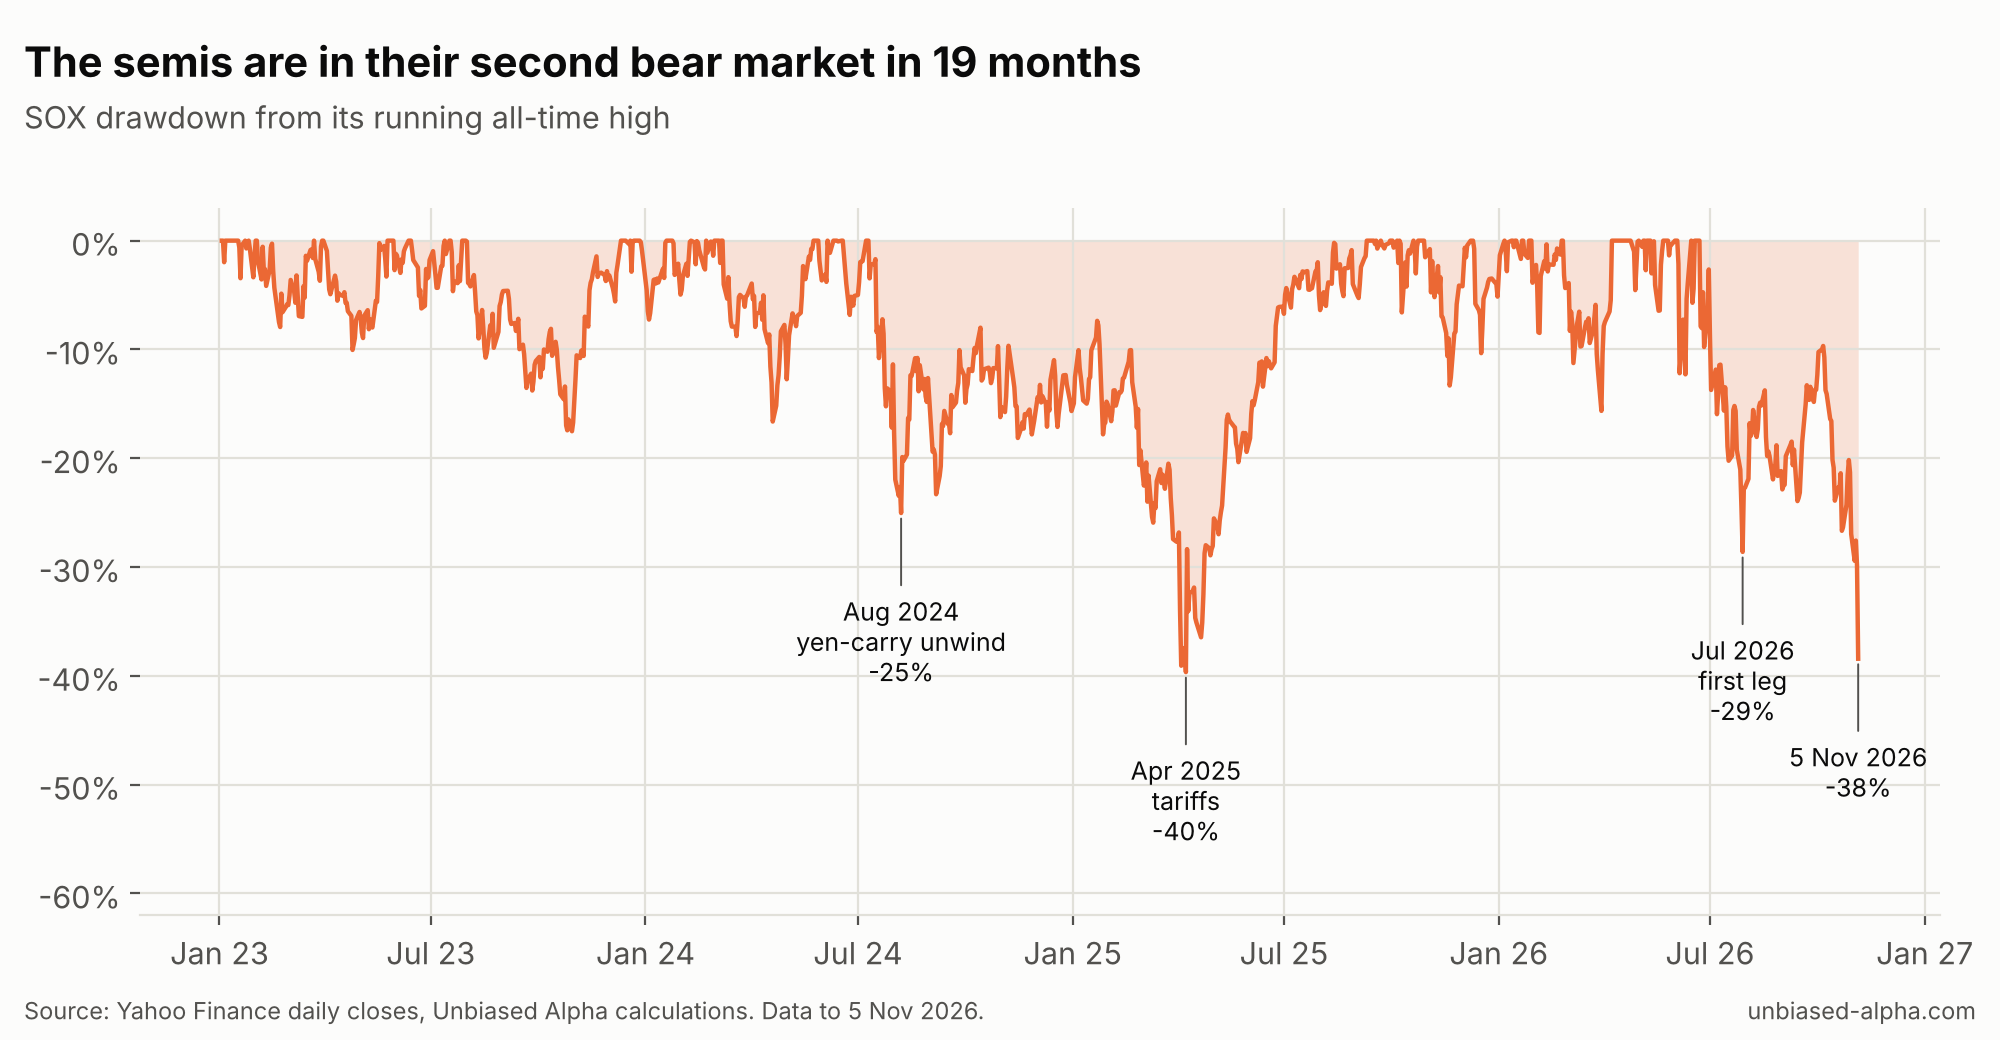
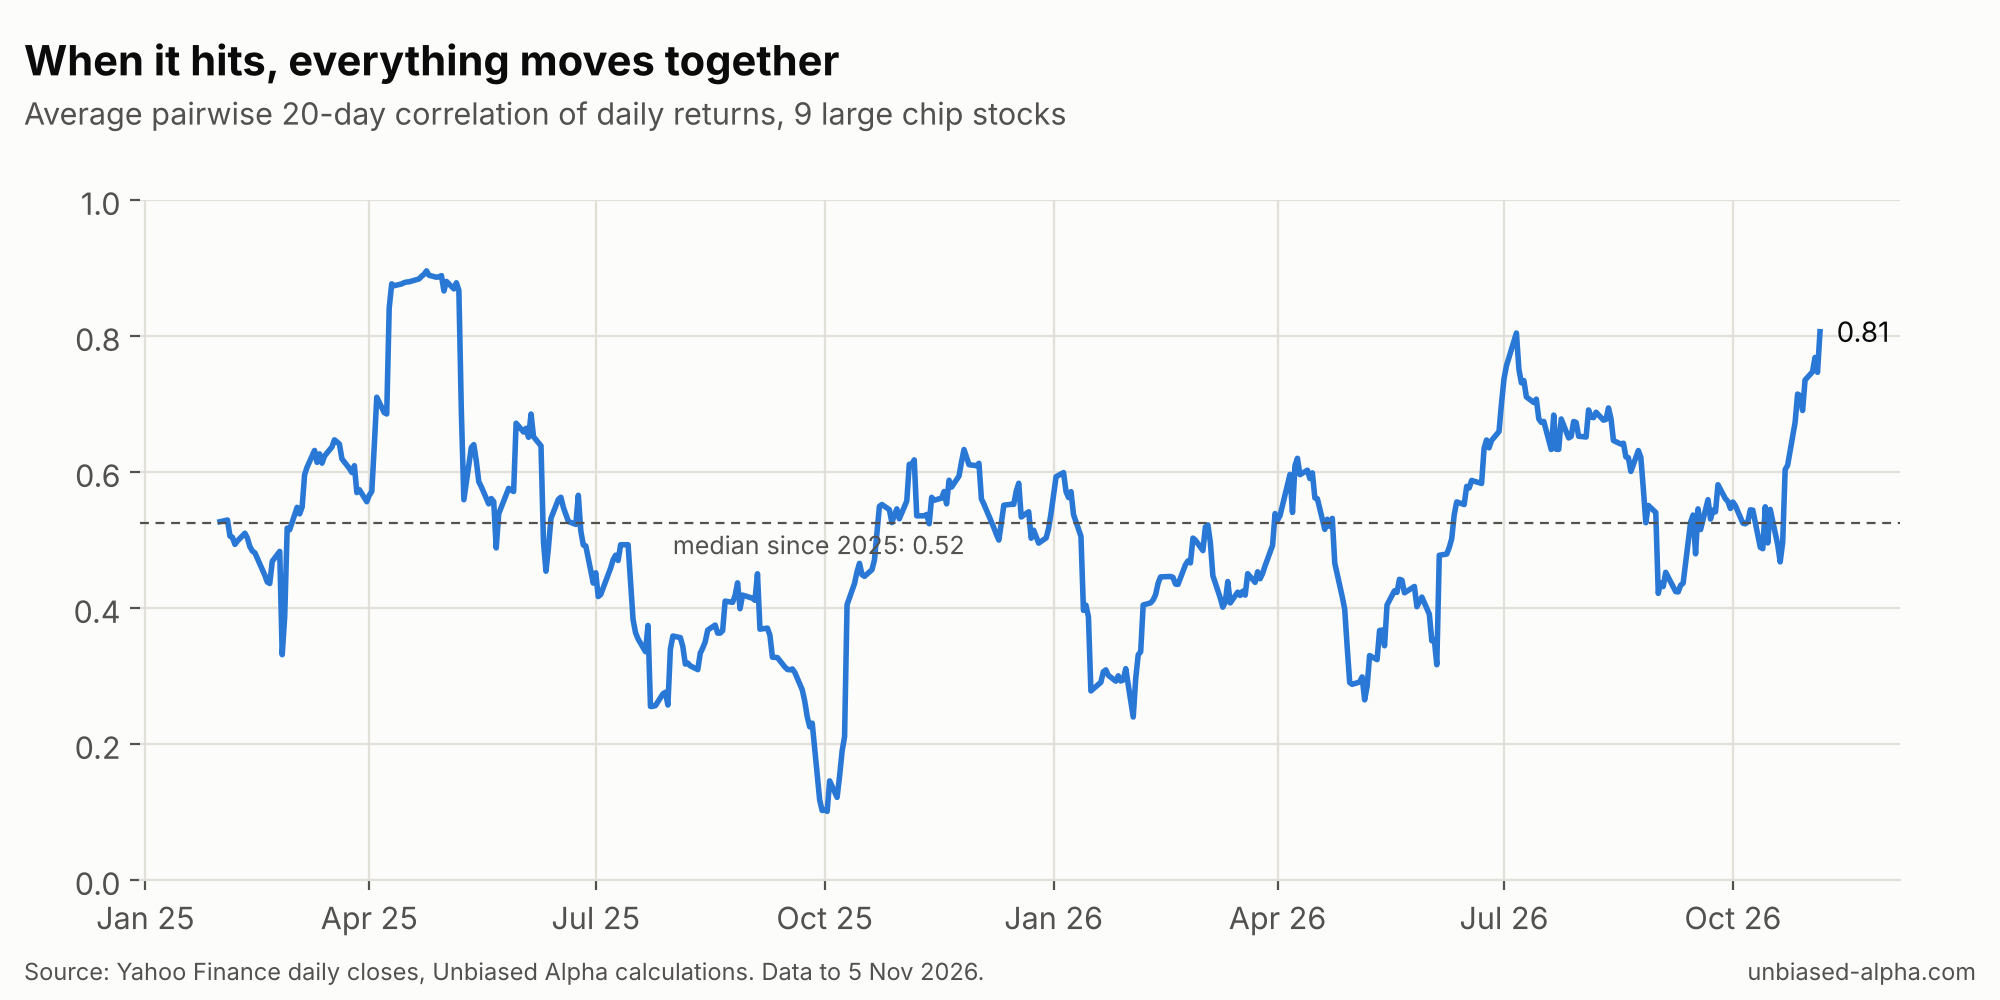
The election explains the direction. (We made a similar point about AI valuations and the cost of capital in our piece on 5% Treasury yields.) It doesn’t explain the size. Two measurements point to positioning:
Correlation. The average pairwise 20-day correlation across nine large chip stocks reached 0.81, compared with a median of 0.52 since January 2025. When Nvidia, Micron, Marvell and Intel all trade as one stock, the market has stopped distinguishing between business models. Memory, custom silicon, foundry and GPUs are being sold as a single factor exposure. That usually happens when crowded books are de-grossed. The reading matches July’s peak and is the highest since the April 2025 tariff crash.
Realised volatility. The SOX’s 20-day realised vol is 63% annualised, against a one-year median of 38%.
Cembalest put it bluntly before Thursday’s session, describing the selloff as influenced by “a heavy bout of hedge fund profit-taking.” The YTD figures in section 1 support this. Funds that are +130% on a name and see a policy shock coming don’t wait for confirmation.
The other catalysts were real but secondary. Qualcomm’s handset business missed. A reported labour dispute at a Micron site in Taiwan was denied by the company. Seoul sold off overnight (Kospi -5.3%) ahead of the US open.
5. What history says (and why it isn't much)
Here is the question everyone asks after an AI stock selloff like this one. We took every day since 2020 on which the SOX fell more than 7%, kept only the first day in each cluster, and measured what came after.
| Selloff day | SOX that day | +1 month | +3 months |
|---|---|---|---|
| 9 Mar 2020 | -8.3% | +1.7% | +28.3% |
| 1 Aug 2024 | -7.1% | +6.2% | +6.0% |
| 3 Sep 2024 | -7.8% | +7.1% | +6.2% |
| 27 Jan 2025 (DeepSeek) | -9.1% | +2.8% | -12.7% |
| 3 Apr 2025 (tariffs) | -9.9% | +11.9% | +42.3% |
| 5 Jun 2026 | -10.3% | +2.9% | -4.0% |
All six were higher one month later. Four of six were higher after three months. This is n = 6. This table does not represent a signal, but it shows how it went in the past. (Treating it as one is a classic route to overfitting.) The spread of three-month outcomes, from -13% to +42%, is the more honest message: after shocks like this, the range of outcomes widens far more than the average shifts.
What we're watching
We don’t make calls on this blog, but these are the measurements we’ll keep tracking:
- Nvidia earnings on 17 November. Jensen Huang’s last line was that “capacity is the constraint,” not demand. If guidance confirms that, the spender-vs-supplier gap should narrow.
- The correlation gauge. A drop back toward 0.5 would mean the market has started telling business models apart again. In past episodes, correlations eased as the forced selling ended.
- The VIX term structure. A return to contango (VIX below VIX3M) would signal that the acute phase is over.
- Actual policy, not campaign promises. For example, a Texas data-centre moratorium is a campaign pledge until January. The audit-driven permit pause already in place is real.
An AI stock selloff like this one tends to feel like a unique event while it’s happening. In the data, however, they almost never are. This one combines policy repricing, a crowded factor unwinding, and some ordinary earnings disappointments.
Methodology: daily closing prices from Yahoo Finance (for research-grade feeds, see AuraStream and our comparison of market data APIs), 2 Jan 2020 – 5 Nov 2026. Returns are price returns. Group figures are equal-weighted averages. Correlation is the mean of pairwise 20-day Pearson correlations of daily returns for NVDA, AMD, AVGO, MU, MRVL, QCOM, INTC, TSM and ASML. Sigma uses the trailing 250-day standard deviation of SOX daily returns. News context from CNBC, Reuters, The Motley Fool and StockTitan coverage of 4–5 November 2026.
This article is for informational purposes only and is not investment advice. Unbiased Alpha is not an asset manager and does not provide personalised financial recommendations.